library(raster)
iranLevel1 <- getData("GADM", country = "Iran", level = 1)
iranLevel2 <- getData("GADM", country = "Iran", level = 2)
library(ggplot2)
map1 <- fortify(iranLevel1)
map1$id <- as.integer(map1$id)
dat1 <- data.frame(id = 1:(length(iranLevel1@data$NAME_1)), state = iranLevel1@data$NAME_1)
library(dplyr)
map_df1 <- inner_join(map1, dat, by = "id")
library(rgeos)
centers1 <- data.frame(gCentroid(iranLevel1, byid = TRUE))
centers1$state <- dat1$state
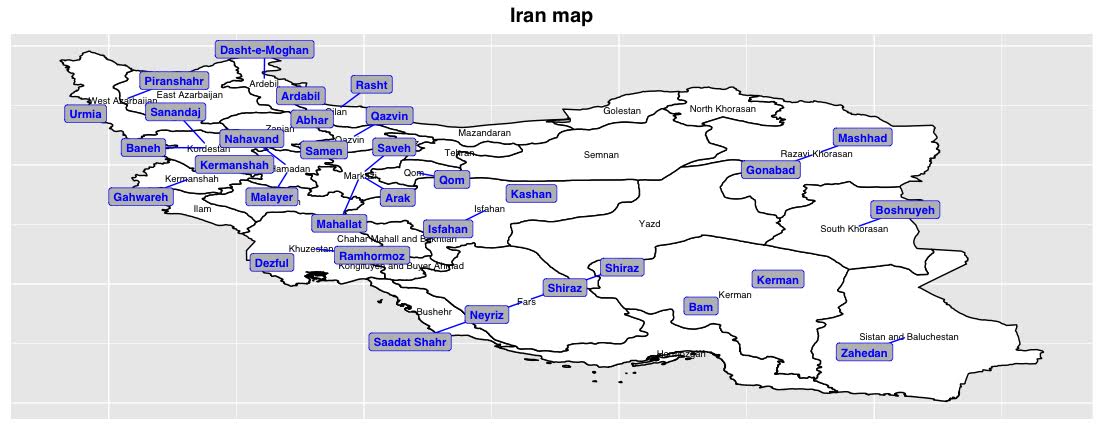
Plot1 <- ggplot() + geom_map(data = map_df1, map = map_df1, aes(x = long, y = lat, map_id = map1$id, group = map1$group), show.legend = FALSE, fill="white",colour = "black") + labs(title = 'Iran map') + theme(plot.title = element_text(family = 'Helvetica', color = "black", face = 'bold', size = 15, hjust = 0.5))
Plot1 <- Plot1 + geom_text(data = centers1, aes(label = state, x = x, y = y), size = 2.5)
# Creat CVS file calles NewCneter which inclus box.padding lables
Plot1 <- geom_label_repel(data = NewCenter, aes(label = state, x = x, y = y), fill = "grey", family = 'Helvetica', fontface = 'bold', color = 'blue', box.padding = unit(0.35, "lines"),point.padding = unit(0.5, "lines"), size = 3) + theme(axis.title = element_blank(), axis.text = element_blank(), axis.ticks = element_blank())